
Monitoring & measuring.

We don’t measure satisfaction. We measure change.

Proven results

It all starts with KPIs defined with you: what are we trying to change, and how will we know it worked?

Before a program launches, we co-build the objectives and indicators that define its success with the manager and HR, specific to your context, your team, your challenges. Not generic metrics.

The principle is a baseline measurement using the same instrument as the exit measurement, and ideally a control group or comparable period to isolate the program’s effect from other external factors (seasonality, market conditions, etc.): that’s what makes the number defensible rather than merely self-reported.

Three levels of indicators

  1. Business indicators

    Engagement, talent retention, productivity, sales: the metrics you already track, and the ones we align the program’s objectives with from day one.

  2. Managerial and relational performance indicators

    Level of trust, ease of communication, number of difficult conversations, frequency of feedback given and received, team cohesion, psychological safety, conflict resolution effectiveness.

  3. Adoption indicators

    Have participants genuinely integrated the new behaviors into their daily work?

What our clients observe on average

  • +96%

    adoption of new postures

    How it’s measured

    Tracked through the app: across all assigned micro-actions, we calculate the % of participants who confirmed practicing at least a predefined number of micro-actions in a real-life situation (self-reported, supplemented by forum posts).

  • +27%

    in team confidence

    How it’s measured

    Team survey before/after (1–5 Likert scale, e.g. “I trust my manager to make good decisions”), average score calculated across the team at both points. Formula: (score after − score before) / score before.

    Example: average score before = 3.3/5, average score after = 4.2/5 → (4.2 − 3.3) / 3.3 = +27%.

  • +35%

    in high-value conversations (feedback, difficult conversations, active listening)

    How it’s measured

    Tracked via the meetings reported: average number of successful conversations per person per month, before vs. after.

    Example: 4 high-value conversations/month before → 5.4/month after = +35%.

  • +22%

    in employee engagement

    How it’s measured

    Standard engagement survey already used by the client (eNPS, Gallup Q12, or an internal equivalent), run on the relevant team before and after, ideally benchmarked against a control team that didn’t go through the program, to isolate the program’s effect.

    Example: favorable engagement score of 65% before → 79% after → +22% relative increase.

  • +17%

    bottom-line results (+28% in commercial results)

    How it’s measured

    Business metrics the client already tracks (revenue, margin, sales) for the trained team, compared over an equivalent period before/after.

  • +23%

    in customer satisfaction (in retail)

    How it’s measured

    CSAT or NPS already collected by the client at store/team level, compared before/after over a comparable period (same season), ideally vs. control stores that didn’t go through the program.

    Example: CSAT before = 71% → CSAT after = 87% → +23% relative increase.

Our Power 21 web app

Growth that happens together

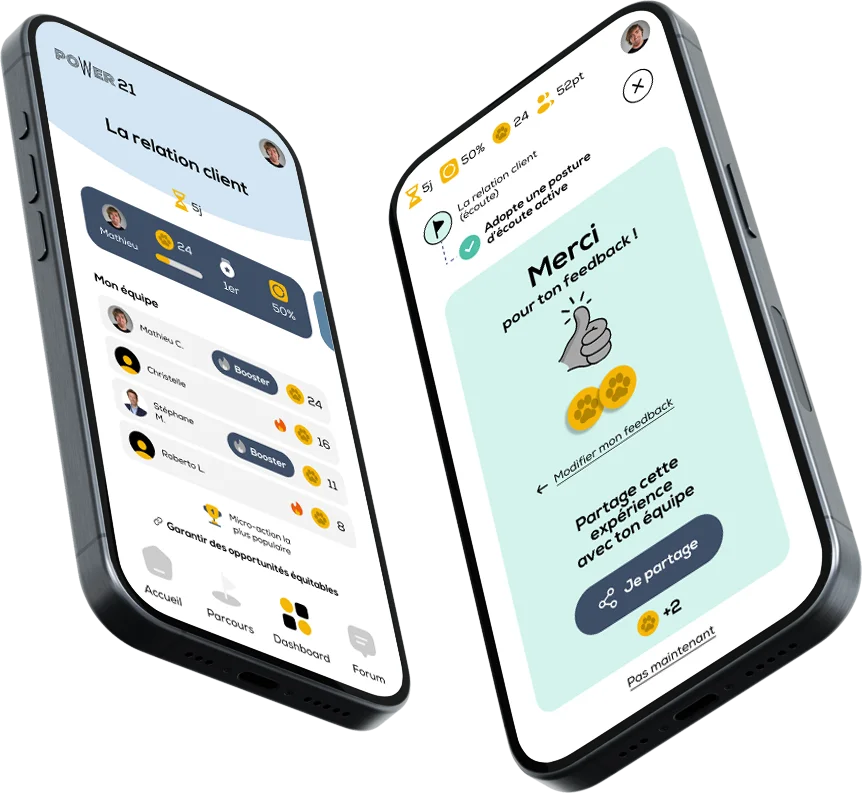
What sets our tracking apart is that it doesn’t stop at a micro-action. On our web app, each participant receives their micro-actions, puts them into practice on the ground, and then shares their results on their action team’s forum: their wins, their best practices, but also their struggles and failures. It’s this ongoing, actively facilitated sharing dynamic that turns a series of individual exercises into genuine collective learning.

In practice, the dashboard gives a clear view of individual and collective progress at any time, while video workshops with the coach revisit what’s been shared on the forum and help capitalize on everyone’s examples. It’s this real-world practice data, not just training attendance, that feeds our adoption indicators.

The Power 21 app on two smartphones: team dashboard and a completed micro-action

A before/after assessment, not an impression

Every program starts with a positioning assessment of key competencies. That same assessment is repeated at the end of the program, making it possible to see, in black and white, the gap between the starting point and the finish line: which competencies improved, by how much, and where to focus the next phase of support.

This isn’t a vague “I feel better” impression: it’s a measurement, on the same scales, at two different points in time, that objectifies the transformation.

Learn more about our anchoring app

Success story

Emotions at the heart of relationships

A pilot training program on emotional intelligence, followed by a micro-action campaign to anchor the learning. Measured results: overall rating of 4.7/5; nearly all participants expressed a strong intent to act on concrete areas (active listening, handling difficult conversations).

The overall “before and after” assessment shows a 23% improvement in key skills across the entire three-month program.

  • 4.7/5 overall rating
  • +23% in key skills in 3 months

“There’s a before and an after Power 21.”

“I feel like I handle sensitive situations much better now.”

“I was finally able to face difficult conversations I’d been putting off for far too long.”

“Trust within the team has grown stronger.”

View all testimonials

Want to define the indicators to improve?

Book a meeting

Open in a new tab